The Income Statement
The Income Statement
Introduction
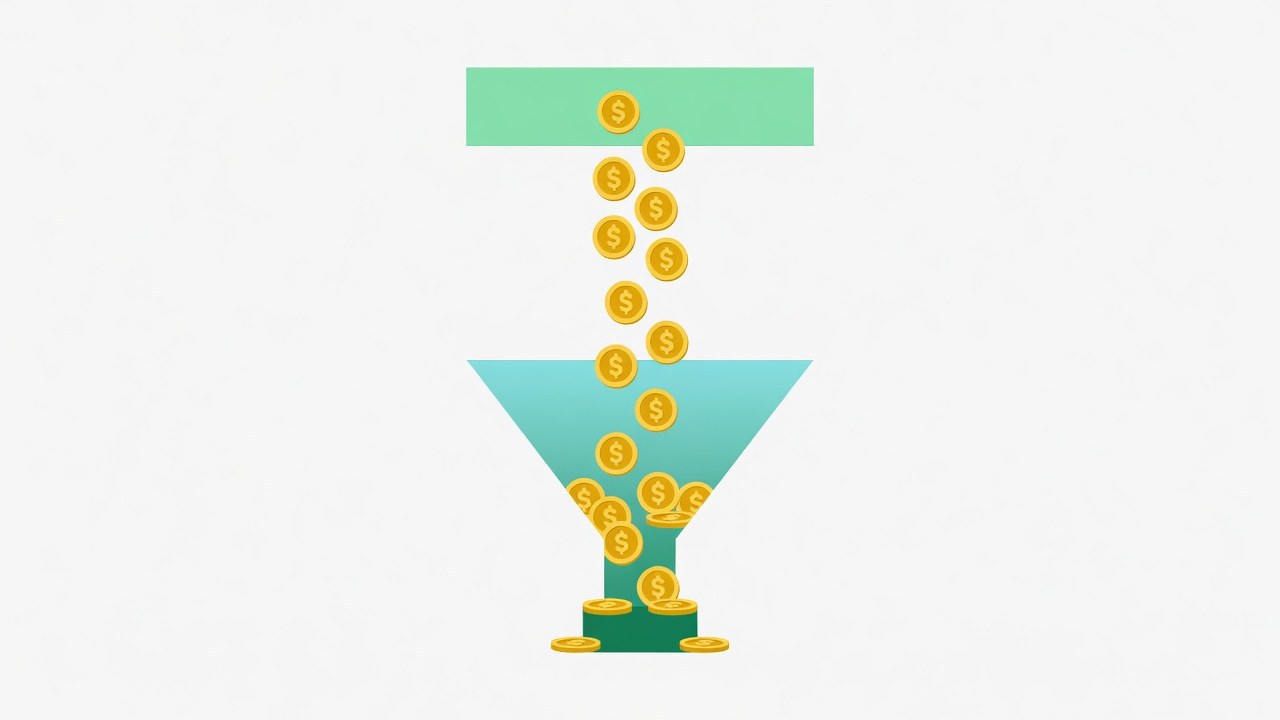
The income statement measures a company's profitability over a period. It runs from revenue at the top to net income at the bottom. This lesson walks through each line.
Revenue
Revenue (sales) is the money a company earns from selling goods or services. It's the top line — where everything begins.
Cost of Goods Sold and Gross Profit
Cost of goods sold (COGS) is the direct cost of producing what's sold.
Revenue - COGS = Gross profit
Gross profit shows how much is left after direct production costs.
Operating Expenses and Operating Profit
Operating expenses (OpEx) include selling, general, administrative, and R&D costs.
Gross profit - Operating expenses = Operating profit
Operating profit reflects profitability from the core business, before interest and tax.
Interest, Tax and Net Income
Operating profit - Interest - Tax = Net income
Net income is the famous "bottom line" — the true profit after everything.
Earnings per Share (EPS)
EPS = Net income ÷ shares outstanding. It converts total profit into a per-share figure, making it directly comparable to the share price.
Reading Quality
Watch for:
- Consistent gross margins (pricing power)
- Operating margins improving over time
- Net income driven by core operations, not one-offs
Real-World Example
A company earns $100M revenue, pays $60M in COGS (40% gross margin), $25M in OpEx, leaving $15M operating profit. After $3M interest and $4M tax, net income = $8M. With 4M shares, EPS = $2.00.
Summary
- Revenue → gross profit → operating profit → net income
- Gross profit = revenue − COGS
- Operating profit = profit from core business
- Net income is the bottom line after interest and tax
- EPS = net income ÷ shares, tying profit to price
Next Lesson
The other two statements: balance sheet and cash flow.
Quiz - Quiz - The Income Statement
1. Revenue is...
2. Gross profit equals...
3. Net income is...
4. Earnings per share (EPS) is...