Sampling Distributions and the Central Limit Theorem
Sampling Distributions and the Central Limit Theorem
Introduction
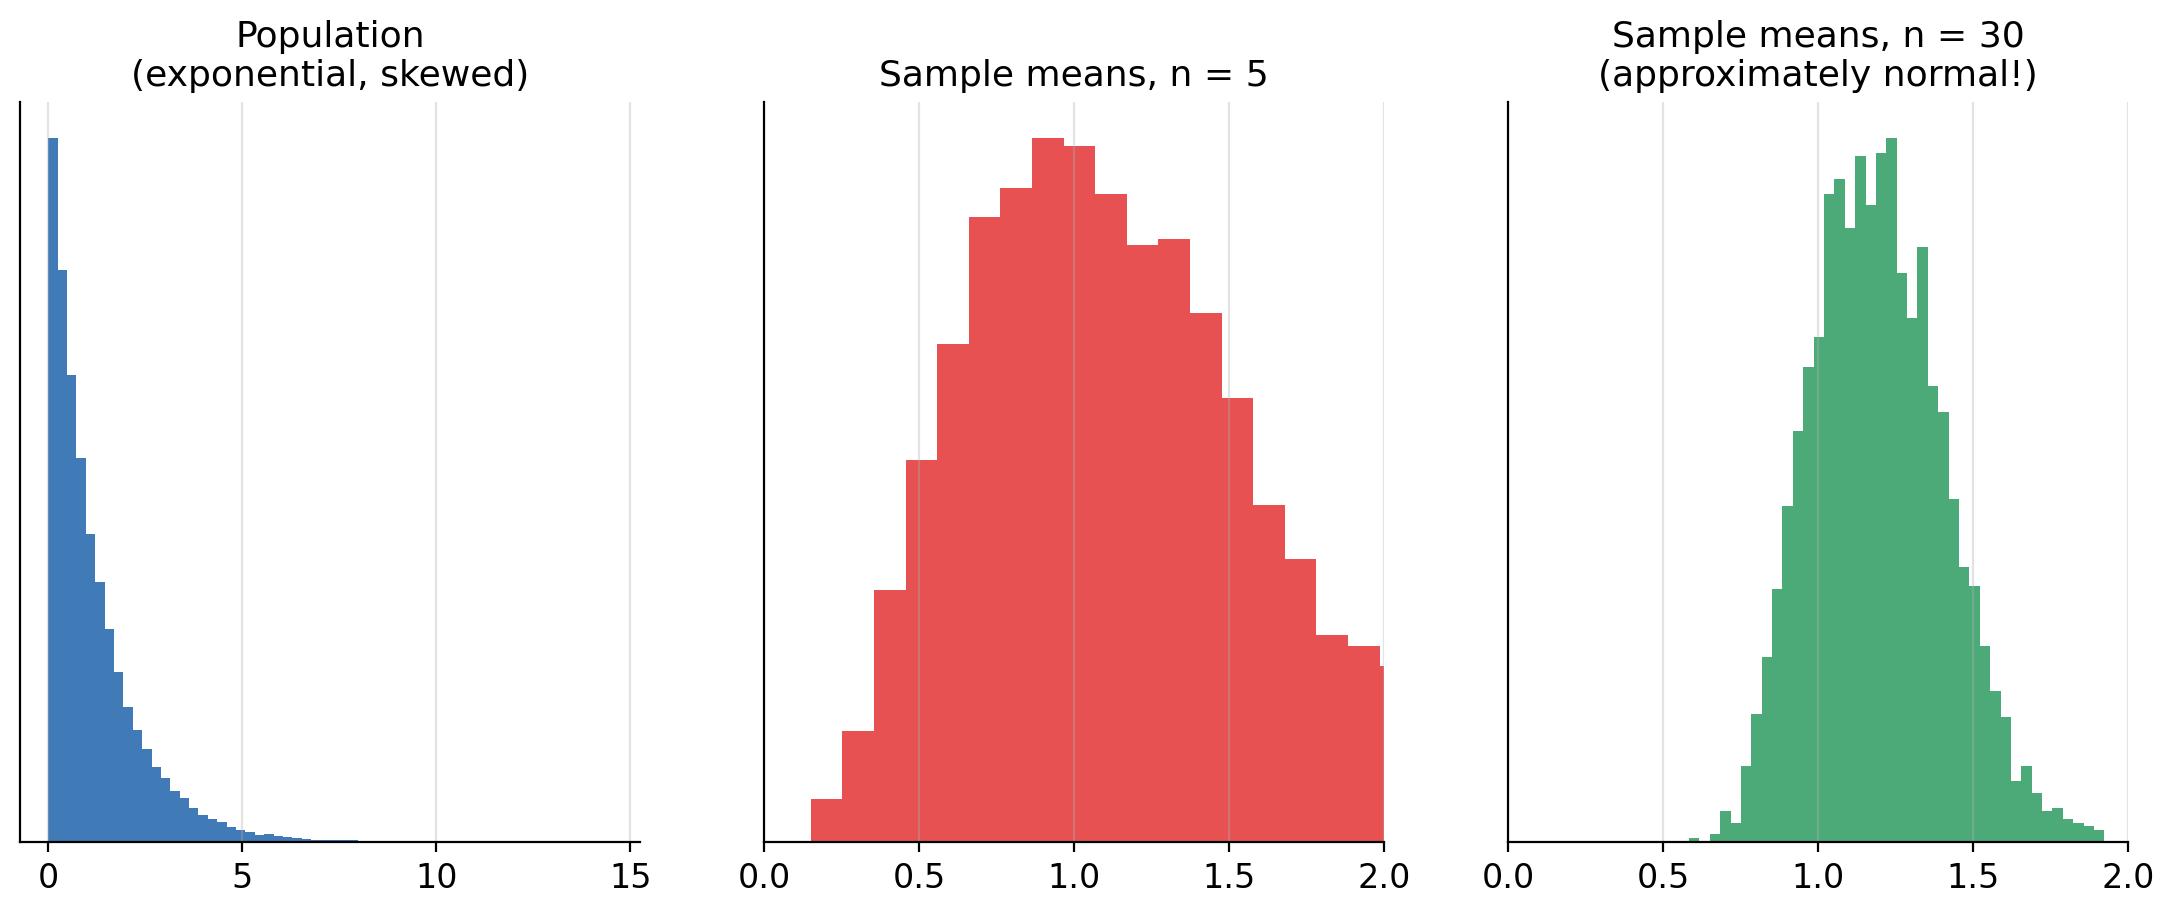
The Central Limit Theorem (CLT) is the most important idea in inferential statistics. It says: if you take many samples from ANY population and compute their means, those sample means form a normal distribution - even if the original population is not normal at all. This is why we can build confidence intervals and run tests on all kinds of real-world data.
What Is a Sampling Distribution?
A sampling distribution is the distribution of a statistic (like the mean) computed from many samples of the same size, drawn from the same population.
Steps to build one empirically:
1. Draw a random sample of size n. 2. Compute its mean. 3. Repeat thousands of times. 4. Plot all the means.
import numpy as np
import matplotlib.pyplot as pltHighly skewed population: exponential
rng = np.random.default_rng(17)
population = rng.exponential(1.2, 100000)def sample_means(n, repeats=3000):
return np.array([np.mean(rng.choice(population, n)) for _ in range(repeats)])
means5 = sample_means(5)
means30 = sample_means(30)
print(f"population mean: {population.mean():.3f}")
print(f"mean of sample means (n=5): {means5.mean():.3f}")
print(f"mean of sample means (n=30): {means30.mean():.3f}")
Output:
population mean: 1.200
mean of sample means (n=5):  1.201
mean of sample means (n=30): 1.201
The average of the sample means equals the population mean. Sampling distributions are centered at the truth.
The Two Big Claims of the CLT
1. Shape: as n grows, the sampling distribution of the mean approaches a normal distribution, no matter the population shape. 2. Spread: the standard deviation of the sample means (the standard error) is:
SE = sigma / sqrt(n)
Notice: bigger samples give tighter sampling distributions. The histogram for n=30 in the figure is visibly narrower and bell-shaped.
Standard Error vs Standard Deviation
- Standard deviation describes how individual values vary around the population mean.
- Standard error describes how sample means vary around the population mean. It is always smaller (by sqrt(n)).
n = 50
se = population.std() / np.sqrt(n)
print(f"population std: {population.std():.3f}")
print(f"standard error of the mean (n=50): {se:.3f}")
Output:
population std: 1.199
standard error of the mean (n=50): 0.170
How Large Does n Need to Be?
Rule of thumb: n >= 30 is usually enough for the CLT to kick in, IF the population is not extremely skewed. For heavily skewed populations, larger samples (n >= 100 or more) are safer. If the population is already normal, any sample size works.
Applications: Where the CLT Shows Up
- Confidence intervals: the sample mean follows a normal distribution, so we can quantify our uncertainty.
- Hypothesis testing: t-tests compare means using the sampling distribution.
- A/B testing: conversion rate differences are tested with sampling distributions of proportions.
- Quality control: sample means of product batches cluster around the target.
The CLT for Proportions
The same logic works for proportions (e.g., conversion rate p). Sample proportions have:
mean = p
SE = sqrt(p * (1 - p) / n)
p_true = 0.25
n = 400
se_p = np.sqrt(p_true * (1 - p_true) / n)
print(f"SE of sample proportion: {se_p:.4f}")
Output:
SE of sample proportion: 0.0217
Common Pitfalls
- Thinking the CLT makes the DATA normal (it makes the SAMPLE MEANS normal).
- Using the population standard deviation in the SE formula instead of sigma / sqrt(n).
- Ignoring the sample size - small n with skewed data gives unreliable means.
Summary
- The sampling distribution of the mean is approximately normal for large n.
- Its mean equals the population mean.
- Its standard deviation (standard error) is sigma / sqrt(n).
- The CLT powers confidence intervals, t-tests and A/B testing.
- Rule of thumb: n >= 30, more for heavily skewed populations.
Next Lesson
Time to apply the CLT: the next lesson builds confidence intervals - ranges that capture the true parameter with a chosen level of confidence.
Quiz - Quiz - Central Limit Theorem
1. The Central Limit Theorem says that for large samples, the sampling distribution of the mean is:
2. The standard error of the mean equals:
3. The mean of the sampling distribution of the mean equals:
4. A common rule of thumb for the CLT to hold is:
5. The CLT makes SAMPLE MEANS normal, not: