Confidence Intervals
Confidence Intervals
Introduction
A sample mean alone is a point estimate - one number, with no idea how precise it is. A confidence interval (CI) fixes this by reporting a whole range of plausible values. "We are 95% confident the true average order value is between 48 and 56 dollars" is far more informative than "the average is 52 dollars".
The Idea
Because of the Central Limit Theorem, sample means are normally distributed around the true mean, with standard error sigma / sqrt(n). We can therefore build an interval around our sample mean that covers the true mean in 95% of samples:
95% CI = sample_mean +- 1.96 * SE
       = sample_mean +- 1.96 * sigma / sqrt(n)
The magic number 1.96 is the z-value that cuts off the middle 95% of a standard normal distribution.
from scipy import stats
z_95 = stats.norm.ppf(0.975)   # middle 95%
print(f"z for 95% CI: {z_95:.3f}")
Output:
z for 95% CI: 1.960
Building a Confidence Interval in Python
import numpy as np
from scipy import statsrng = np.random.default_rng(23)
sample = rng.normal(50, 10, 40) # n = 40, true mean = 50
n = len(sample)
mean = sample.mean()
se = sample.std(ddof=1) / np.sqrt(n) # we usually don't know sigma, use sample std
z = stats.norm.ppf(0.975)
ci = (mean - z se, mean + z se)
print(f"sample mean: {mean:.2f}")
print(f"95% CI: ({ci[0]:.2f}, {ci[1]:.2f})")
Output:
sample mean: 49.63
95% CI: (46.51, 52.75)
What "95% Confidence" Really Means
This is the most misunderstood concept in statistics:
- Correct: if you repeated this experiment 100 times, about 95 of the intervals would contain the true mean.
- Wrong: "the true mean has a 95% probability of being in this interval."
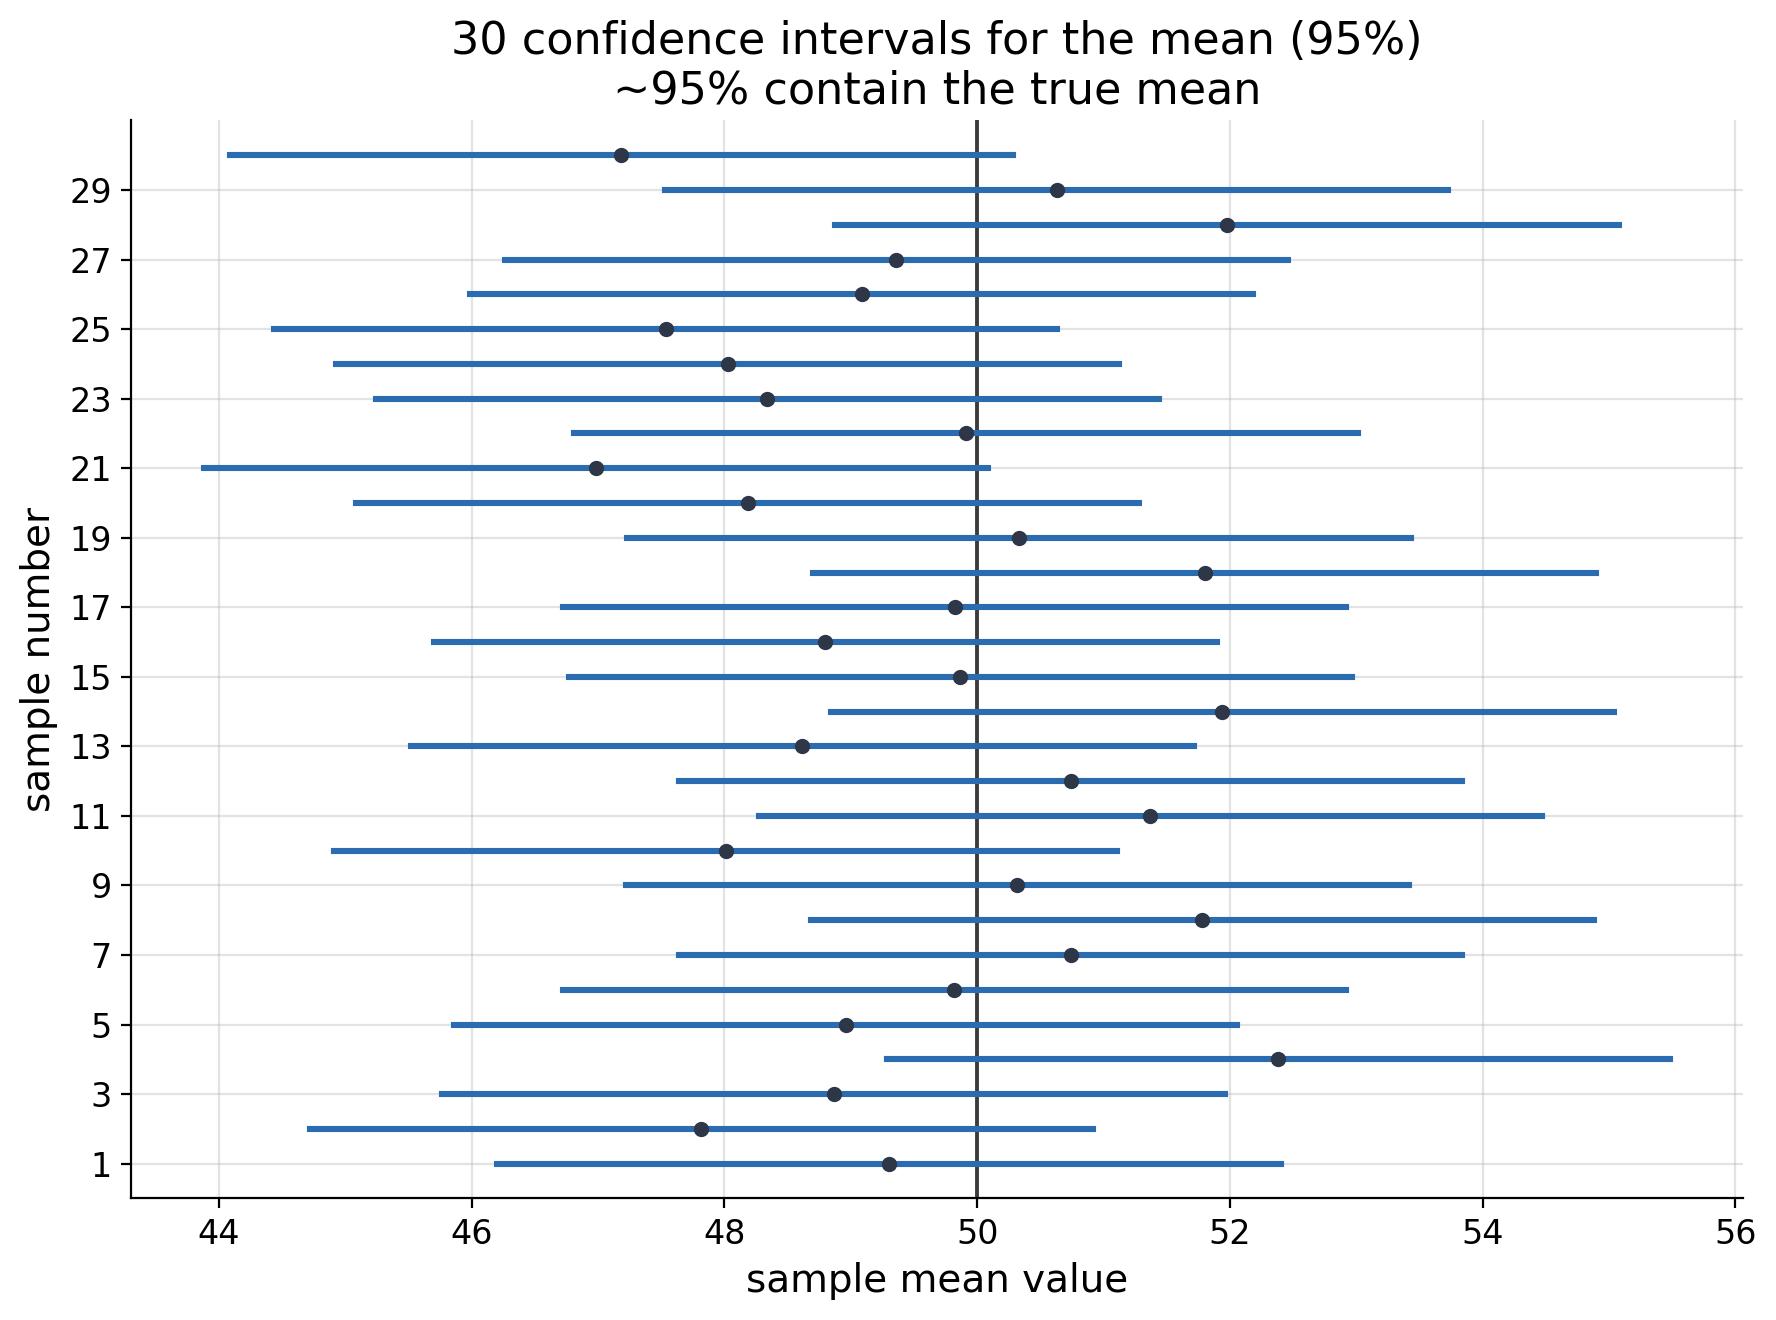
In the figure above, 30 intervals were built from 30 samples of the same population. About 29 (95%) cover the true mean (vertical line); one or two miss it. That is the definition of a 95% CI in action.
When to Use z vs t
Real life rarely gives you the population standard deviation sigma. When you estimate sigma from the sample, the t-distribution (with n-1 degrees of freedom) is the correct tool - it produces slightly wider intervals to account for the extra uncertainty.
| Situation | Distribution | Critical value |
|---|---|---|
| sigma known, large n | z | 1.96 (95%) |
| sigma unknown, small n | t with n-1 df | t* > 1.96 |
| sigma unknown, large n | t (approaches z) | ~1.96 |
t_star = stats.t.ppf(0.975, df=n-1)
print(f"t* for n=40: {t_star:.3f}   (vs z = 1.960)")
Output:
t* for n=40: 2.023 (vs z = 1.960)
The Trade-Off: Width vs Confidence
- Higher confidence (99%) -> wider intervals -> safer but less precise.
- Lower confidence (90%) -> narrower intervals -> more precise but riskier.
- Larger sample size -> narrower intervals (SE shrinks with sqrt(n)).
se = sample.std(ddof=1) / np.sqrt(n)
for conf, z in [(0.90, 1.645), (0.95, 1.960), (0.99, 2.576)]:
    half = z * se
    print(f"{conf100:.0f}% CI: ({mean-half:.2f}, {mean+half:.2f}), width {2half:.2f}")
Output:
90% CI: (46.90, 52.36), width 5.46
95% CI: (46.51, 52.75), width 6.24
99% CI: (45.61, 53.65), width 8.04
Confidence Intervals for Proportions
For a proportion p-hat (e.g., conversion rate):
95% CI = p_hat +- 1.96 sqrt(p_hat (1 - p_hat) / n)
p_hat = 120 / 400       # 120 conversions out of 400 visitors
se_p = np.sqrt(p_hat * (1 - p_hat) / 400)
ci_p = (p_hat - 1.96  se_p, p_hat + 1.96  se_p)
print(f"conversion rate: {p_hat:.3f}")
print(f"95% CI: ({ci_p[0]:.3f}, {ci_p[1]:.3f})")
Output:
conversion rate: 0.300
95% CI: (0.255, 0.345)
Common Pitfalls
- Misinterpreting "95% confident" as a probability statement about the parameter.
- Using z when sigma is unknown (use t for small samples).
- Forgetting that intervals shrink with sqrt(n), not n.
Summary
- A CI is a range of plausible values for a parameter.
- 95% CI = statistic +- 1.96 SE (z) or t * SE (small samples).
- "95% confidence" refers to the procedure, not the parameter.
- More confidence = wider interval; bigger sample = narrower interval.
- Proportions get CIs too, with SE = sqrt(p(1-p)/n).
Next Lesson
The last big tool of the course: hypothesis testing and p-values - how to decide whether an observed difference is real or just noise.
Quiz - Quiz - Confidence Intervals
1. A 95% confidence interval means that:
2. The critical z-value for a 95% confidence interval is:
3. When the population standard deviation is unknown and the sample is small, you should use:
4. Increasing the confidence level from 95% to 99% makes the interval:
5. Increasing the sample size makes the confidence interval: