Types of Data and Measurement Scales
Types of Data and Measurement Scales
Introduction
Before doing any analysis, you must know what kind of data you are holding. The type of data decides which charts, summary statistics, and tests are allowed. Using the wrong tool for a data type is one of the most common analyst mistakes.
The Big Split: Qualitative vs Quantitative
| Broad type | Also called | What it describes | Examples |
|---|---|---|---|
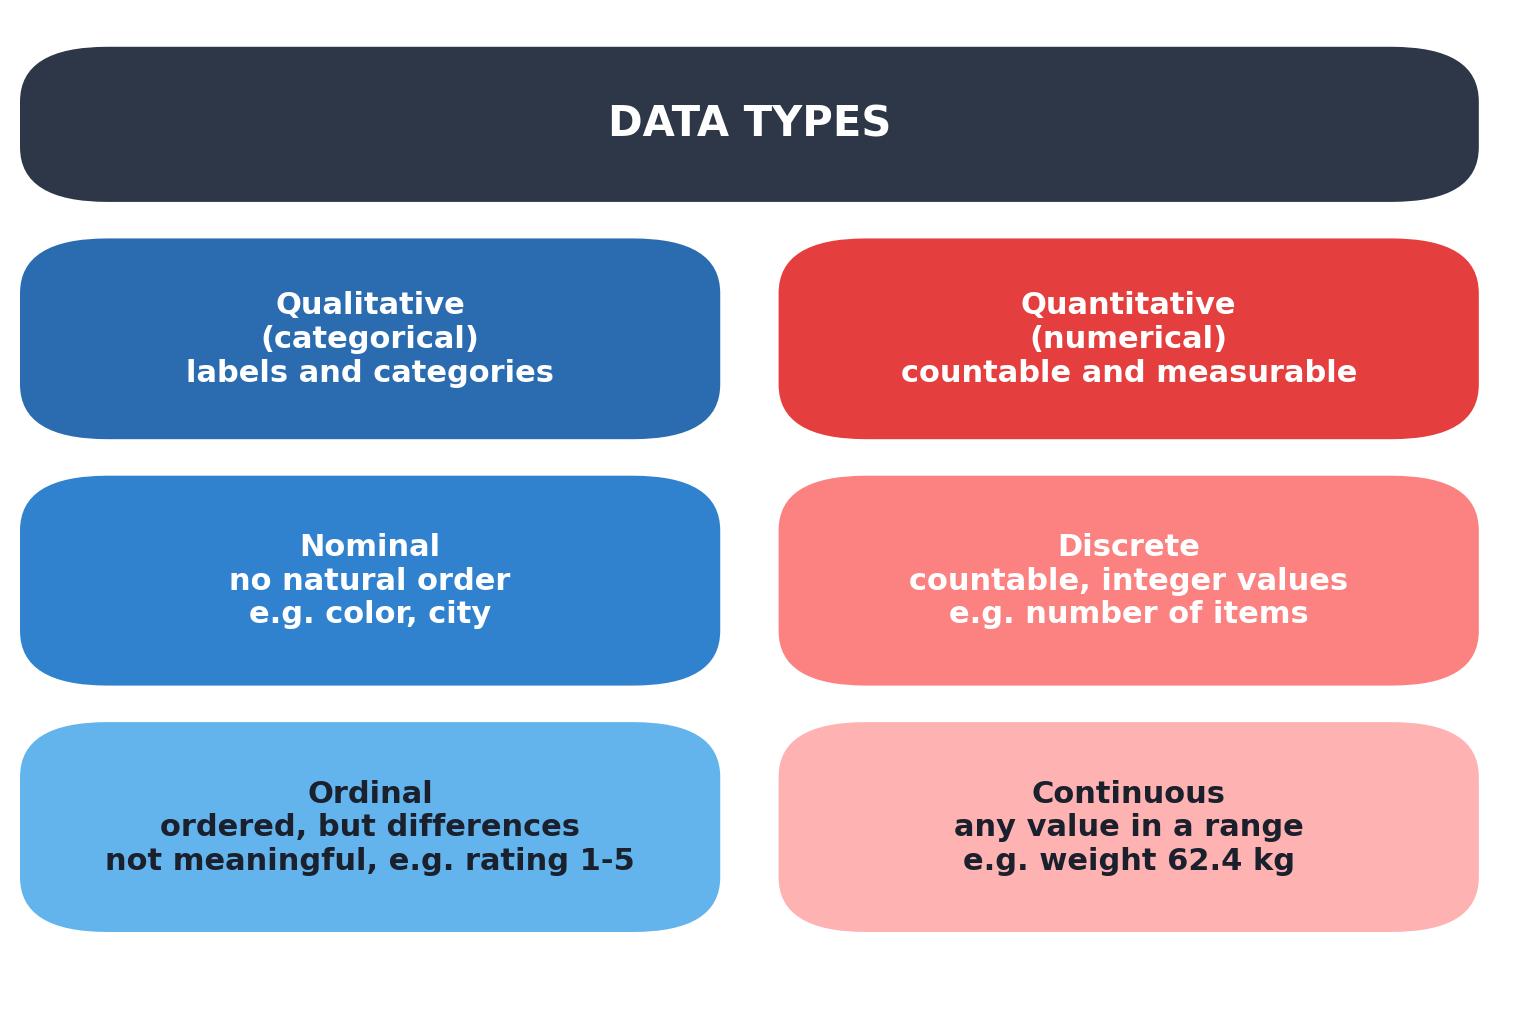
| Qualitative | Categorical | Labels and categories | color, country, job title |
| Quantitative | Numerical | Counts and measurements | price, age, weight |
Qualitative Data
Nominal Scale
Categories with no natural order. The labels are just names.
- Eye color: blue, green, brown
- City: Warsaw, Berlin, Paris
- Payment method: card, cash, transfer
Ordinal Scale
Categories with a meaningful order, but the gaps between them are not equal or known.
- Customer satisfaction: very unhappy, unhappy, neutral, happy, very happy
- Education level: primary, secondary, bachelor, master, doctorate
- Star ratings: 1 to 5 stars
Quantitative Data
Discrete Data
Values that come from counting and take only whole numbers (or a limited set of values).
- Number of items in a cart
- Number of website visits per day
- Number of defects in a batch
Continuous Data
Values that can take any number within a range, limited only by measurement precision.
- Weight: 62.4 kg, 62.41 kg, 62.412 kg...
- Time on page: 143.7 seconds
- Temperature: 21.56 °C
Why the Distinction Matters
The data type determines your toolkit:
| Data type | Typical chart | Typical summary | Typical test |
|---|---|---|---|
| Nominal | Bar chart | Mode, proportions | Chi-square |
| Ordinal | Bar chart (ordered) | Median, percentiles | Rank-based tests |
| Discrete | Bar chart, histogram | Mean, median, mode | Depends on shape |
| Continuous | Histogram, box plot | Mean, std, quartiles | t-test, ANOVA |
Example: Choosing the Wrong Test
A common beginner mistake: running a t-test (which needs continuous data) on star ratings (ordinal). The t-test assumes equal, meaningful intervals, which star ratings do not have. The correct approach is a rank-based test such as the Mann-Whitney U test.
Python: Checking Data Types
import pandas as pddf = pd.DataFrame({
"country": ["PL", "DE", "PL", "FR", "DE"],
"rating": [5, 3, 4, 2, 5], # ordinal
"items_in_cart":[1, 3, 0, 2, 5], # discrete
"order_value": [42.5, 19.9, 88.0, 12.3, 67.8] # continuous
})
print(df.dtypes)
Output:
country         object
rating           int64
items_in_cart    int64
order_value    float64
In pandas, object suggests categorical data, while int64 and float64 are numeric. For cleaner analysis you can convert explicitly:
df["country"] = df["country"].astype("category")
df["rating"] = df["rating"].astype("category")  # ordinal: keep order in mind
Common Pitfalls
- Treating ordinal data as continuous just because it is stored as numbers.
- Using a pie chart for continuous data (hides the distribution shape).
- Reporting a mean for nominal data (what is the "mean" of red and blue?).
Summary
- Data is qualitative (nominal, ordinal) or quantitative (discrete, continuous).
- Nominal = unorderable labels; ordinal = ordered labels with unequal gaps.
- Discrete = counts; continuous = measurements on a continuous scale.
- Data type decides which charts, summaries, and statistical tests are valid.
Next Lesson
In the next lesson, you will learn about populations and samples, and the sampling methods that keep your analysis honest.
Quiz - Quiz - Types of Data
1. Customer satisfaction ratings (very unhappy, unhappy, neutral, happy, very happy) are what type of data?
2. The number of items in a shopping cart is:
3. Eye color (blue, green, brown) is an example of:
4. Which data type allows any value within a range, limited only by measurement precision?
5. Why can't you run a t-test on star ratings (1-5)?