Populations, Samples and Sampling Methods
Populations, Samples and Sampling Methods
Introduction
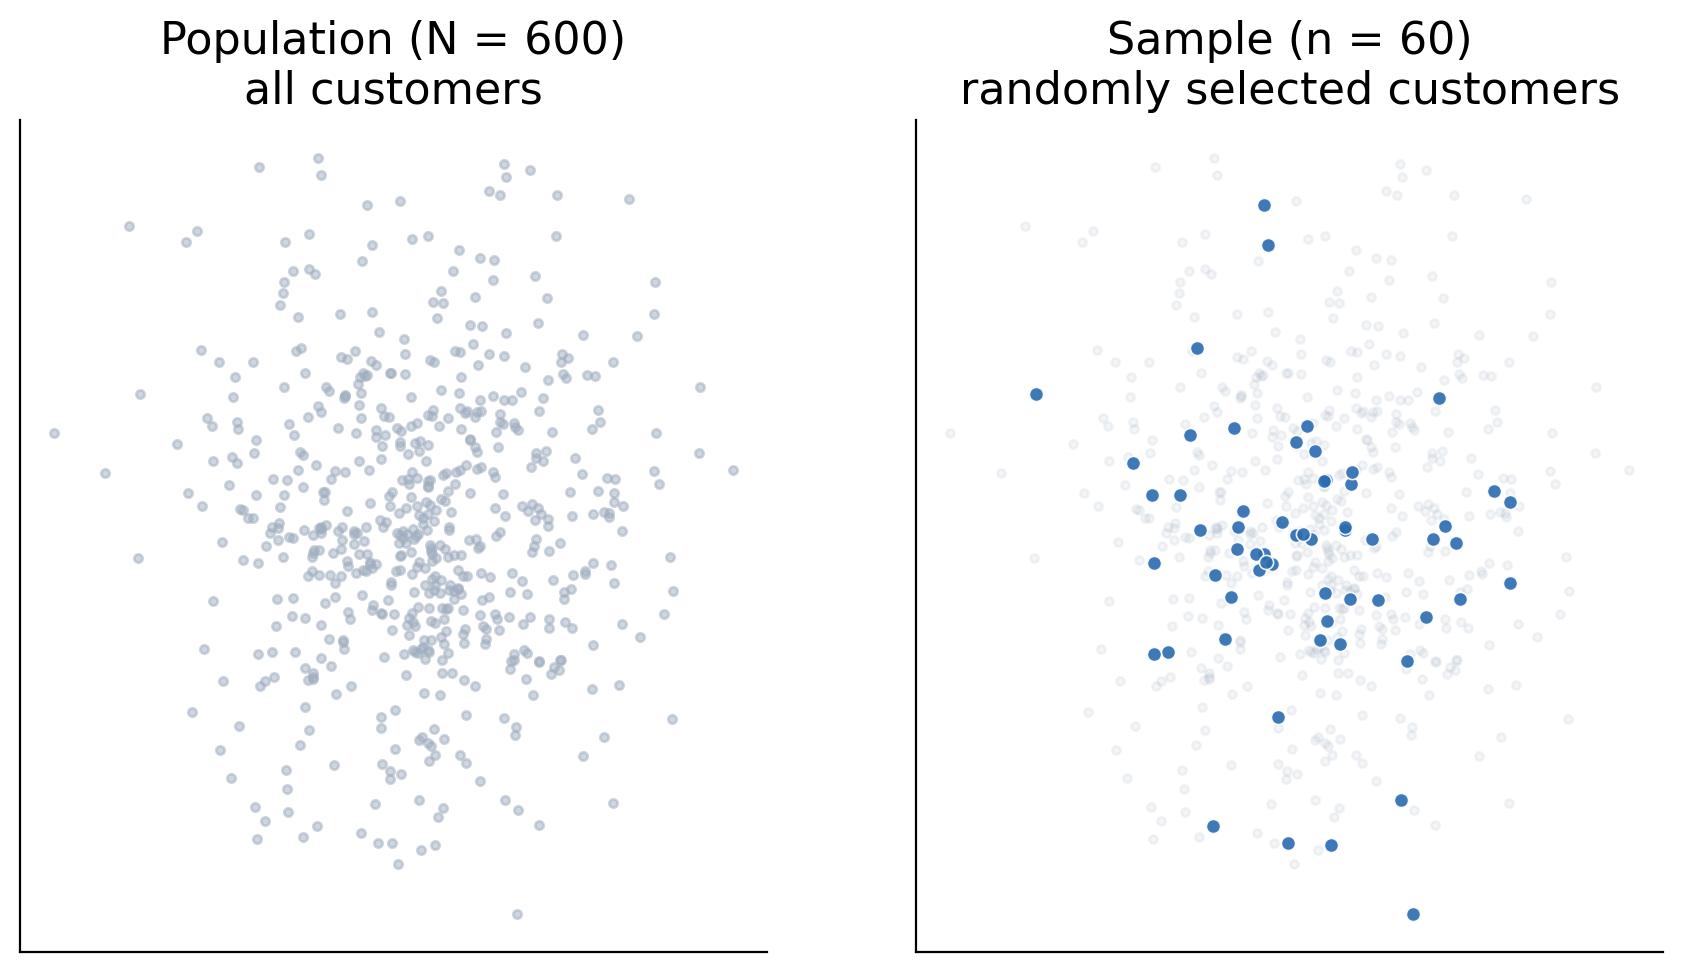
You rarely have access to every single data point you care about. Measuring everyone is expensive, slow, or simply impossible. That is why statistics works with samples - subsets of the population - and uses them to make statements about the whole.
Population vs Sample
- Population: every individual or item of interest. Example: all 2 million customers of a webshop.
- Sample: the subset you actually collect data from. Example: 400 randomly chosen customers.
A parameter (like population mean μ) is what you want to know. A statistic (like sample mean x̄) is what you can compute. The gap between them is sampling error - not a mistake, just the unavoidable price of not measuring everyone.
Why Not Just Measure Everything?
| Situation | Why sampling wins |
|---|---|
| 2 million customers | Surveying all is too expensive |
| Quality testing light bulbs | Testing destroys the product |
| Measuring blood pressure of patients | Invasive, impractical for all |
| Tracking website users | Impossible to catch every session |
Sampling Methods
1. Simple Random Sampling
Every member of the population has an equal chance of being selected.
import numpy as npcustomers = np.arange(1, 2001)           # 2000 customers
sample = np.random.choice(customers, size=100, replace=False)
print(sample[:10])
Output:
[ 421 1856 1410 902 332 1779 611 743 1296 1154]
2. Stratified Sampling
Split the population into groups (strata), then draw randomly from each group. This guarantees representation.
# Customers split by region; sample 50 from each region
regions = {"PL": np.arange(1, 1001), "DE": np.arange(1001, 1601), "FR": np.arange(1601, 2001)}
sample = np.concatenate([np.random.choice(v, 50, replace=False) for v in regions.values()])
print(f"stratified sample size: {len(sample)}")
3. Systematic Sampling
Pick every k-th element from an ordered list.
population = np.arange(1, 2001)
k = 20
sample = population[::k]   # every 20th customer
print(len(sample))
4. Cluster Sampling
Divide the population into clusters, randomly choose some clusters, then measure everyone inside them. Cheap but less precise.
Bias: The Silent Killer
A sample is only useful if it represents the population. Bias makes a sample systematically different from the population:
| Bias type | Example |
|---|---|
| Selection bias | Surveying only active app users |
| Response bias | Only happy customers reply to feedback |
| Survivorship bias | Analyzing only companies that survived |
| Convenience bias | Asking friends instead of random users |
Example: The Classic Mistake
In 1948 the Chicago Tribune predicted Dewey would beat Truman in the US election, based on a huge sample of over 50,000 phone and mail surveys. The sample was enormous but biased: only people with phones (wealthier) were reached. Truman won. Big sample size does not fix bias.
How Large Should a Sample Be?
Larger samples shrink sampling error, but the gain shrinks too. The standard error of the mean is:
SE = sigma / sqrt(n)
Doubling the sample size reduces the standard error by only about 30% (factor 1/sqrt(2)). Ten times more data gives you sqrt(10) ≈ 3.2 times more precision.
import numpy as npfor n in [50, 200, 800, 3200]:
    ses = []
    for _ in range(2000):
        s = np.random.normal(100, 15, n)
        ses.append(s.std(ddof=1) / np.sqrt(n))
    print(f"n = {n:5d}  avg SE = {np.mean(ses):.2f}")
Output:
n =    50  avg SE = 2.12
n =   200  avg SE = 1.06
n =   800  avg SE = 0.53
n =  3200  avg SE = 0.27
Notice how quadrupling n only halves the standard error.
Summary
- A sample is a subset used to estimate population parameters.
- Statistics (sample) estimate parameters (population).
- Random, stratified, systematic and cluster sampling each have trade-offs.
- Bias cannot be cured by a bigger sample.
- Standard error decreases with sqrt(n).
Next Lesson
In the next lesson you will start descriptive statistics: measures of central tendency - the mean, median and mode, and when to use each.
Quiz - Quiz - Populations and Samples
1. A parameter is a number that describes:
2. Which sampling method splits the population into groups and draws randomly from each?
3. In the 1948 election poll mistake, the huge sample was biased because:
4. Does a very large biased sample give accurate results?
5. If you quadruple the sample size, the standard error: