Hypothesis Testing and p-Values
Hypothesis Testing and p-Values
Introduction
Hypothesis testing answers a binary question with data: "Is the new layout really better than the old one, or is the difference just luck?" The method is deliberately defensive: it starts by assuming nothing changed (the null hypothesis) and only rejects that assumption when the evidence is strong enough.
The Null and Alternative Hypotheses
- Null hypothesis (H0): no effect, no difference, status quo. Example: new layout conversion rate <= old layout conversion rate.
- Alternative hypothesis (H1): what you want to prove. Example: new layout conversion rate > old layout conversion rate.
The Logic in Five Steps
1. State H0 and H1. 2. Choose a significance level alpha (usually 0.05). 3. Compute a test statistic from the data (t, z, chi-square...). 4. Compute the p-value: the probability of seeing a statistic this extreme IF H0 is true. 5. Decide: p < alpha -> reject H0; otherwise, fail to reject H0.
A Worked Example: One-Sample t-Test
A coffee shop claims its large cup contains 400 ml. You measure 30 cups and get a mean of 395 ml with a sample standard deviation of 12 ml. Is the claim false?
import numpy as np
from scipy import statsSimulate 30 measured cups
rng = np.random.default_rng(31)
cups = rng.normal(395, 12, 30)t_stat, p_value = stats.ttest_1samp(cups, popmean=400)
print(f"sample mean: {cups.mean():.2f}")
print(f"t-statistic: {t_stat:.3f}")
print(f"p-value:     {p_value:.3f}")
Output:
sample mean: 396.31
t-statistic: -1.857
p-value:     0.073
The p-value 0.073 is larger than alpha = 0.05, so we fail to reject H0: the data is not strong enough to call the claim false. Notice this does NOT mean the claim is true - it means we lack evidence.
Visualizing the Test
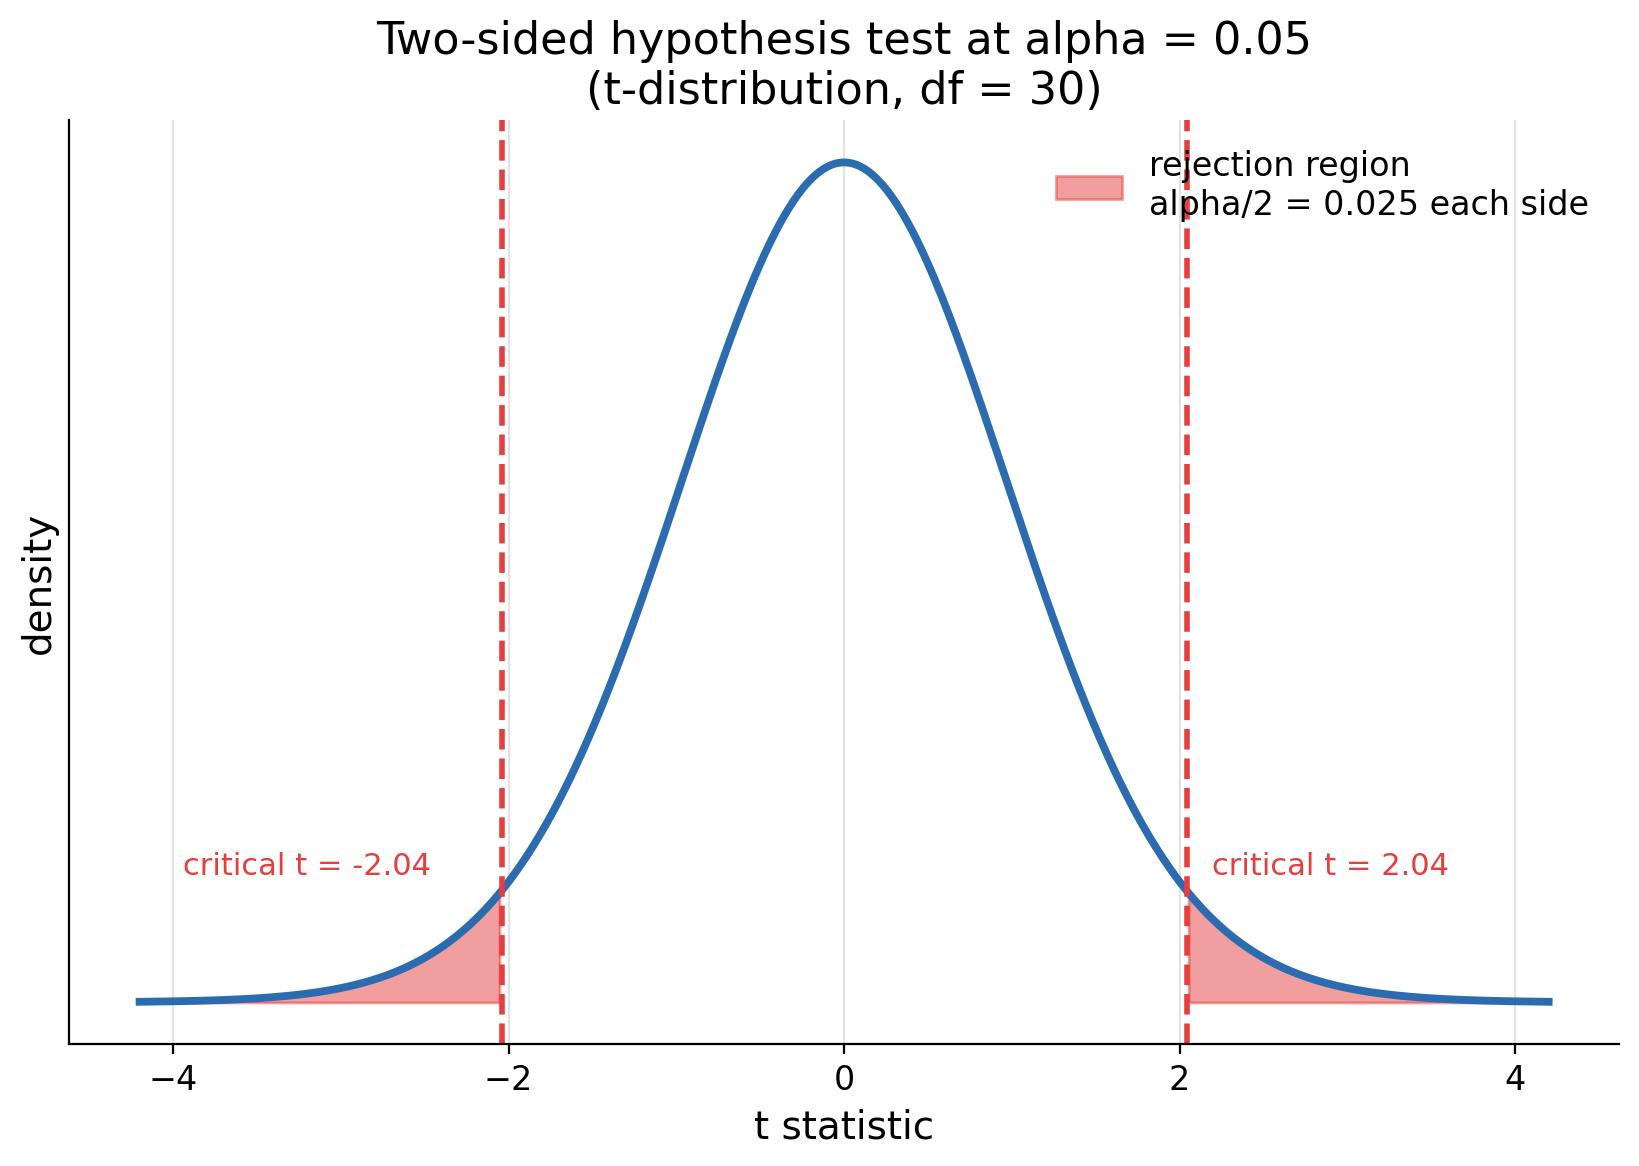
The figure shows a t-distribution with the rejection regions shaded (alpha/2 = 0.025 on each side for a two-sided test). If your test statistic falls in the shaded area, the result is "statistically significant" and you reject H0.
Two Types of Error
| Decision | H0 is true | H0 is false |
|---|---|---|
| Fail to reject H0 | Correct | Type II error (miss) |
| Reject H0 | Type I error (false alarm) | Correct |
- Type I error (alpha): false positive. Probability = alpha (5%).
- Type II error (beta): false negative. Probability depends on sample size and effect size.
- Power = 1 - beta: the chance of detecting a real effect. Bigger samples -> more power.
What p-Values Really Mean
- Correct: "If the null hypothesis is true, the probability of observing data at least this extreme is p."
- Wrong: "The probability that H0 is true is p."
- Wrong: "The probability that I made a mistake is p."
Two-Sample Example: A/B Test
Comparing two groups (control vs variant):
control = rng.normal(0.10, 0.02, 500)   # 10% conversion baseline
variant = rng.normal(0.12, 0.02, 500)   # 12% with new buttont_stat, p_value = stats.ttest_ind(variant, control)
print(f"control mean: {control.mean():.4f}")
print(f"variant mean: {variant.mean():.4f}")
print(f"p-value: {p_value:.4f}")
Output:
control mean: 0.1001
variant mean: 0.1199
p-value: 0.0000
The p-value is far below 0.05, so we reject H0 and conclude the new button increases conversion. Real A/B tests use proportions and z-tests; the logic is identical.
Choosing the Right Test
| Question | Test |
|---|---|
| Mean of one group vs a target | One-sample t-test |
| Means of two independent groups | Two-sample t-test |
| Matched pairs (before/after) | Paired t-test |
| Means of 3+ groups | ANOVA |
| Proportions (conversion) | z-test for proportions |
| Categorical association | Chi-square test |
Common Pitfalls
- Treating "fail to reject" as "H0 is true".
- p-hacking: running many tests and reporting only significant ones.
- Ignoring effect size - a significant result with a tiny effect is still tiny.
- Using alpha = 0.05 as a magic line; context matters.
Summary
- Hypothesis testing starts from a skeptical null hypothesis.
- p-value = probability of extreme data, assuming H0.
- p < alpha -> reject H0 (statistically significant).
- Type I error = false positive; power = chance to catch real effects.
- A non-significant result is not proof of "no effect".
Next Lesson
The final lesson connects statistics to relationships between variables: correlation and regression - measuring strength, direction, and prediction.
Quiz - Quiz - Hypothesis Testing
1. The null hypothesis typically states:
2. A p-value is the probability of:
3. If p < alpha, you:
4. A type I error is:
5. If a test is not significant (p > alpha), you should conclude: