Correlation and Regression
Correlation and Regression
Introduction
Correlation measures how two variables move together; regression uses that relationship to make predictions. These tools are everywhere in business: ad spend vs revenue, temperature vs energy use, engagement vs churn. This lesson shows how to measure the relationship, read it correctly, and fit a prediction line.
The Pearson Correlation Coefficient r
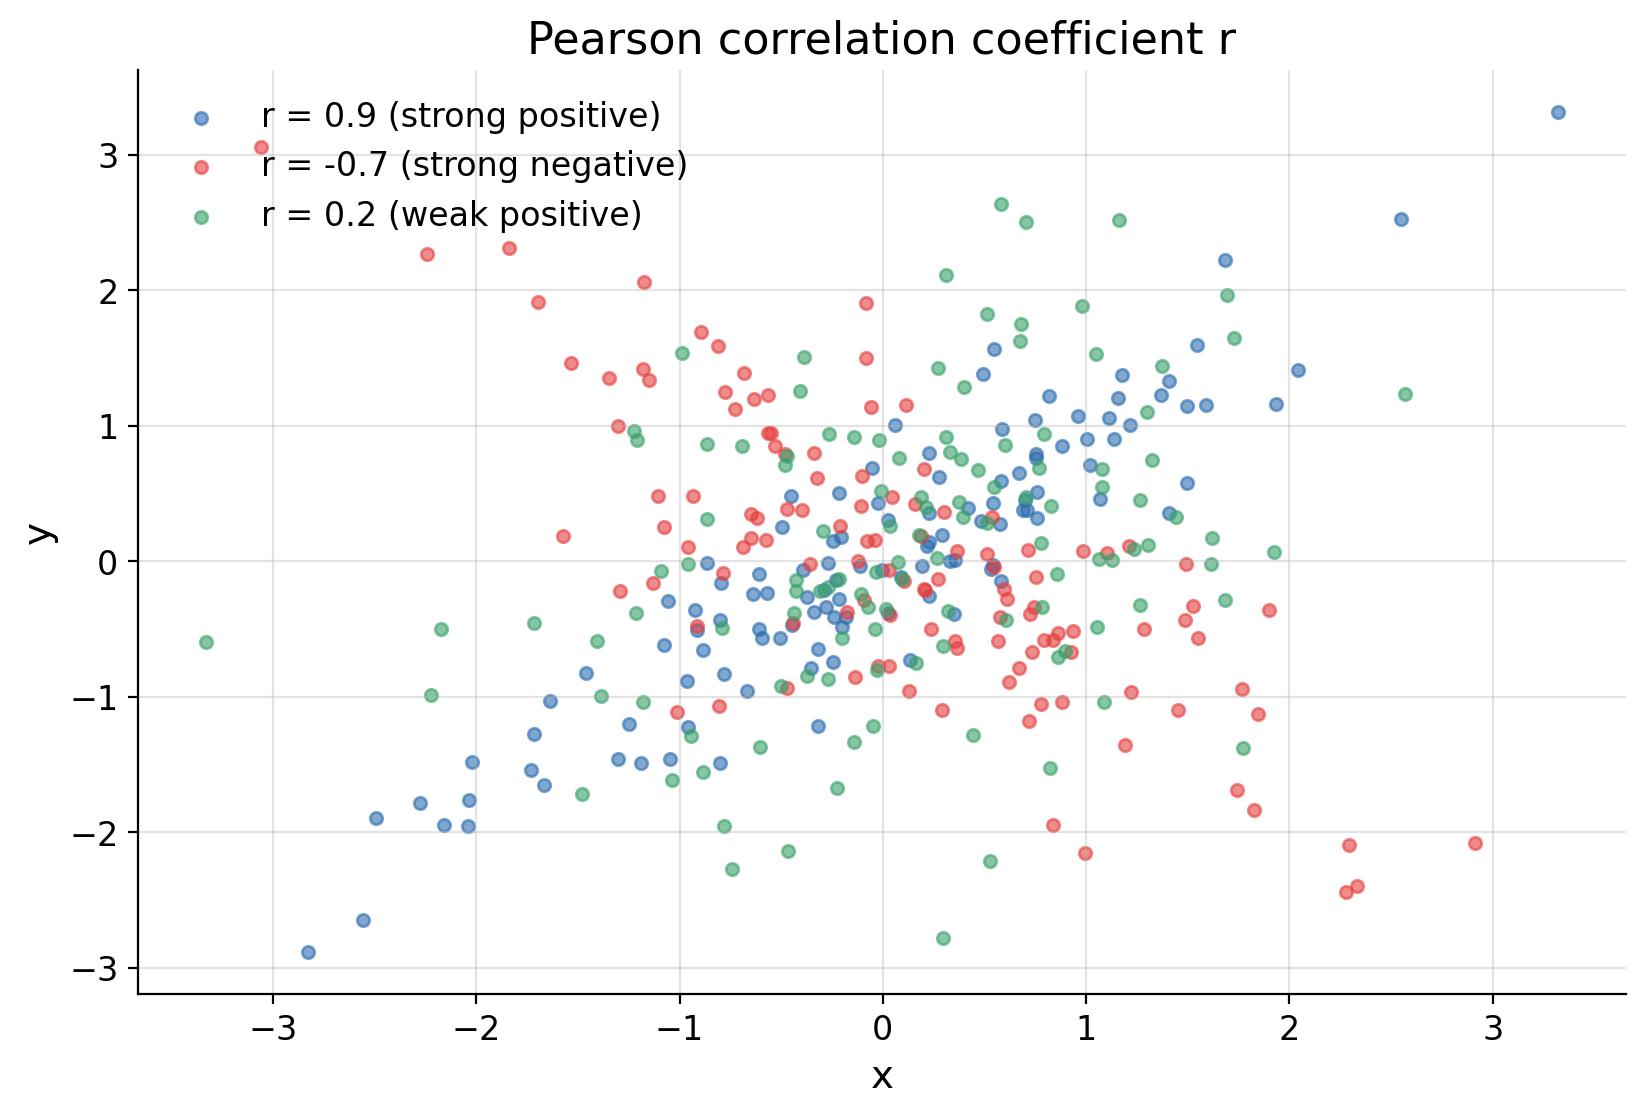
The Pearson correlation r measures the strength and direction of a linear relationship, always between -1 and 1:
- r = 1: perfect positive linear relationship.
- r = -1: perfect negative linear relationship.
- r = 0: no linear relationship.
import numpy as np
from scipy import statsrng = np.random.default_rng(3)
x = rng.normal(0, 1, 120)
y = 0.9 x + np.sqrt(1 - 0.92) rng.normal(0, 1, 120)
r, p = stats.pearsonr(x, y)
print(f"r = {r:.3f} p = {p:.4f}")
Output:
r = 0.899 p = 0.0000
Interpreting r
| r value | Interpretation |
|---|---|
| 0.00 - 0.19 | Very weak |
| 0.20 - 0.39 | Weak |
| 0.40 - 0.59 | Moderate |
| 0.60 - 0.79 | Strong |
| 0.80 - 1.00 | Very strong |
Correlation Is Not Causation
Three reasons two variables can correlate without one causing the other:
1. Confounding: a third variable drives both (ice cream and drowning both rise with summer heat). 2. Reverse causation: maybe Y causes X, not X causes Y. 3. Spurious correlation: pure coincidence with enough data.
Correlation justifies investigating a relationship, not acting on it.
Simple Linear Regression
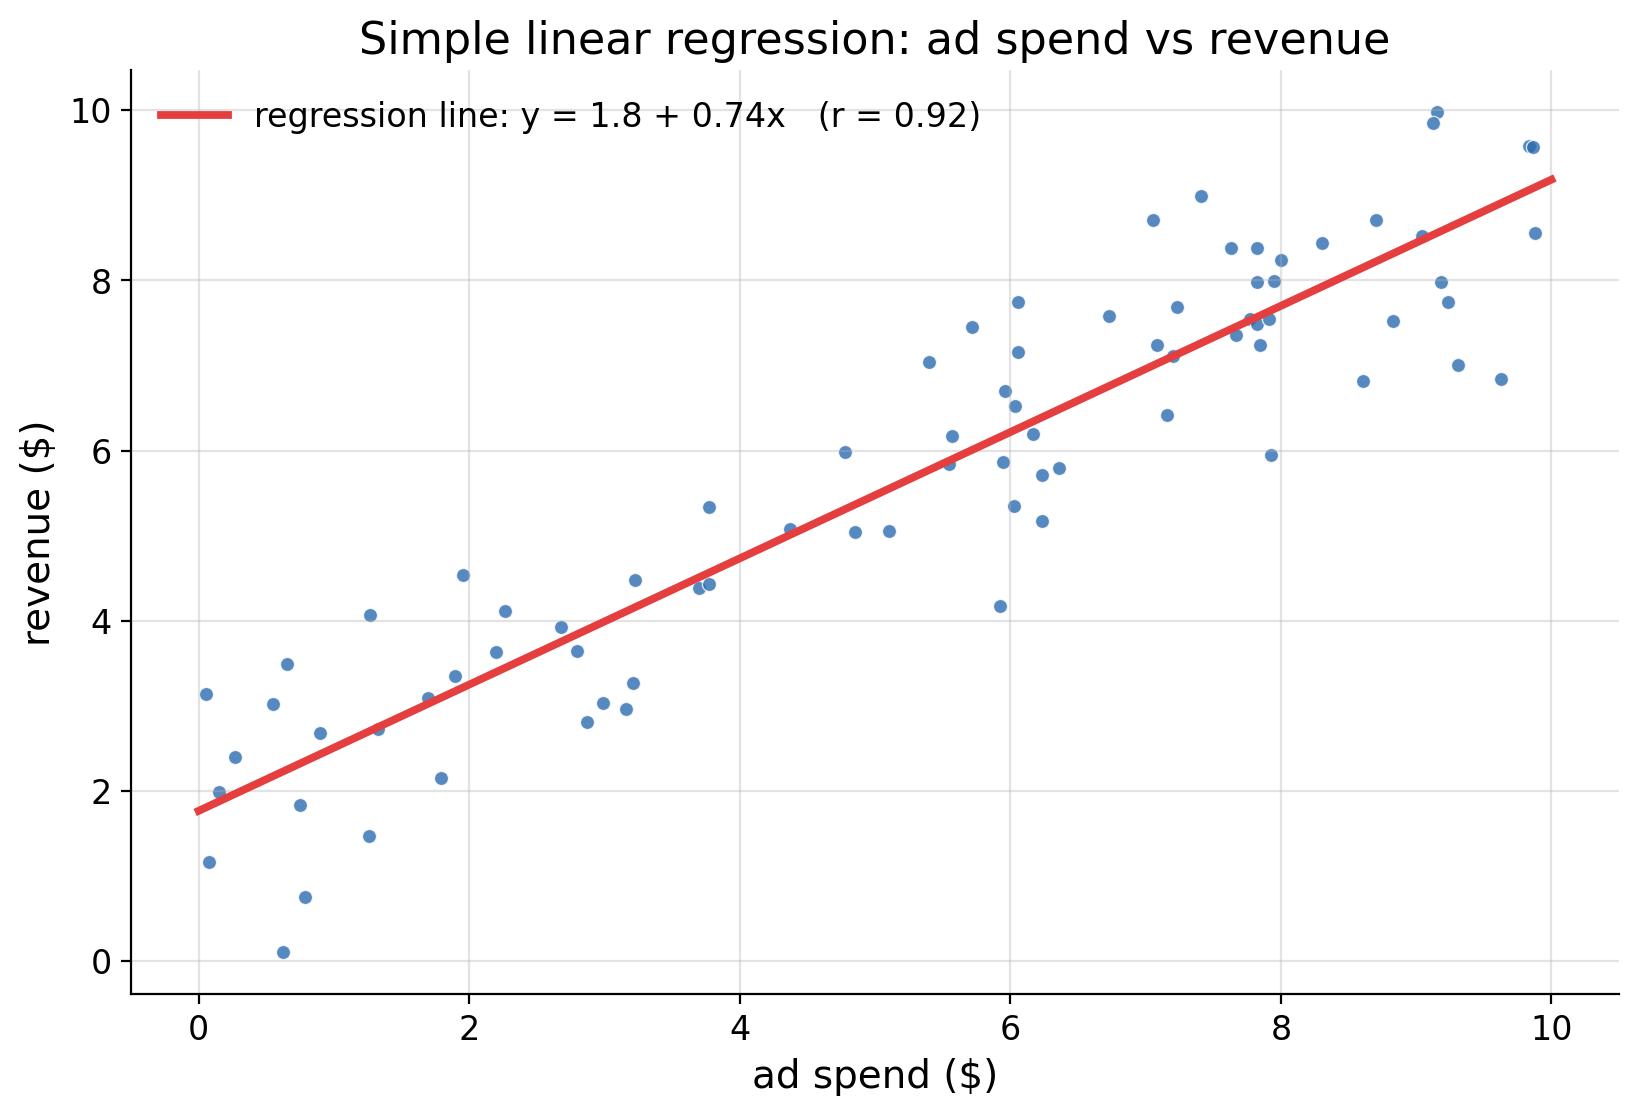
Regression fits a line that predicts Y from X:
y = b0 + b1 * x
- b0 (intercept): predicted Y when X = 0.
- b1 (slope): expected change in Y per 1-unit change in X.
ad_spend = rng.uniform(0, 10, 80)
revenue = 1.8 + 0.7 * ad_spend + rng.normal(0, 0.9, 80)slope, intercept, r_value, p_value, std_err = stats.linregress(ad_spend, revenue)
print(f"intercept: {intercept:.2f}")
print(f"slope:     {slope:.3f}")
print(f"r:         {r_value:.3f}")
print(f"p-value:   {p_value:.4f}")
Output:
intercept: 1.79
slope:     0.700
r:         0.921
p-value:   0.0000
Interpretation: each extra dollar of ad spend adds about 0.70 dollars of revenue (within the observed range).
Making Predictions
pred = intercept + slope * 8.0   # ad spend = 8
print(f"predicted revenue at spend 8: {pred:.2f}")
Output:
predicted revenue at spend 8: 7.39
Caveats:
- Only interpolate inside the observed X range; extrapolation is dangerous.
- The prediction is a mean estimate, not a guarantee.
- Regression assumes a roughly linear relationship and normally distributed errors.
R-Squared: How Good Is the Fit?
R-squared is the square of r (for simple regression). It tells you the share of variance in Y explained by X.
print(f"R-squared: {r_value2:.3f}")
Output:
R-squared: 0.848
84.8% of the variation in revenue is explained by ad spend; the rest comes from other factors and noise.
Correlation vs Regression: Quick Comparison
| Aspect | Correlation | Regression |
|---|---|---|
| Purpose | Measure association | Predict Y from X |
| Output | r in [-1, 1] | Equation y = b0 + b1*x |
| Symmetry | Treats X and Y equally | X causes-ish, Y is predicted |
| Units | Unitless | Depends on variables |
Common Pitfalls
- Concluding causation from correlation.
- Trusting r without plotting the data (Anscombe's quartet!).
- Extrapolating the regression line far beyond the data.
- Ignoring outliers that drag the regression line.
Summary
- r measures linear association: sign = direction, magnitude = strength.
- Correlation is NOT causation; watch for confounders.
- Regression fits y = b0 + b1*x and enables prediction.
- R-squared tells you the share of variance explained.
- Always plot before you conclude.
Next Lesson
Congratulations - you finished Statistics for Data Analysts! Review the quizzes, and if you want to go deeper, check out the Python Programming and Data Analysis courses on the platform.
Quiz - Quiz - Correlation and Regression
1. A Pearson correlation of -0.7 indicates:
2. Correlation does not imply:
3. In the regression equation y = b0 + b1*x, the slope b1 represents:
4. R-squared tells you:
5. Why should you always plot your data before trusting r?