What is Statistics and Why It Matters
What is Statistics and Why It Matters
Introduction
Statistics is the science of collecting, organizing, analyzing, and interpreting data to make decisions. For a data analyst, statistics is not an abstract academic subject: it is the toolkit you use every day to answer questions like "is this campaign working?", "which customer group is most valuable?", or "is the difference between two versions real or just random?"
Descriptive vs Inferential Statistics
Statistics splits into two big branches:
- Descriptive statistics summarize and describe the data you have. Examples: average order value, percentage of returning customers, a histogram of website visit times.
- Inferential statistics use a sample to make conclusions about a larger population. Examples: estimating the average height of all users from a sample of 500, testing whether a new layout increases conversion.
Example: Order Values
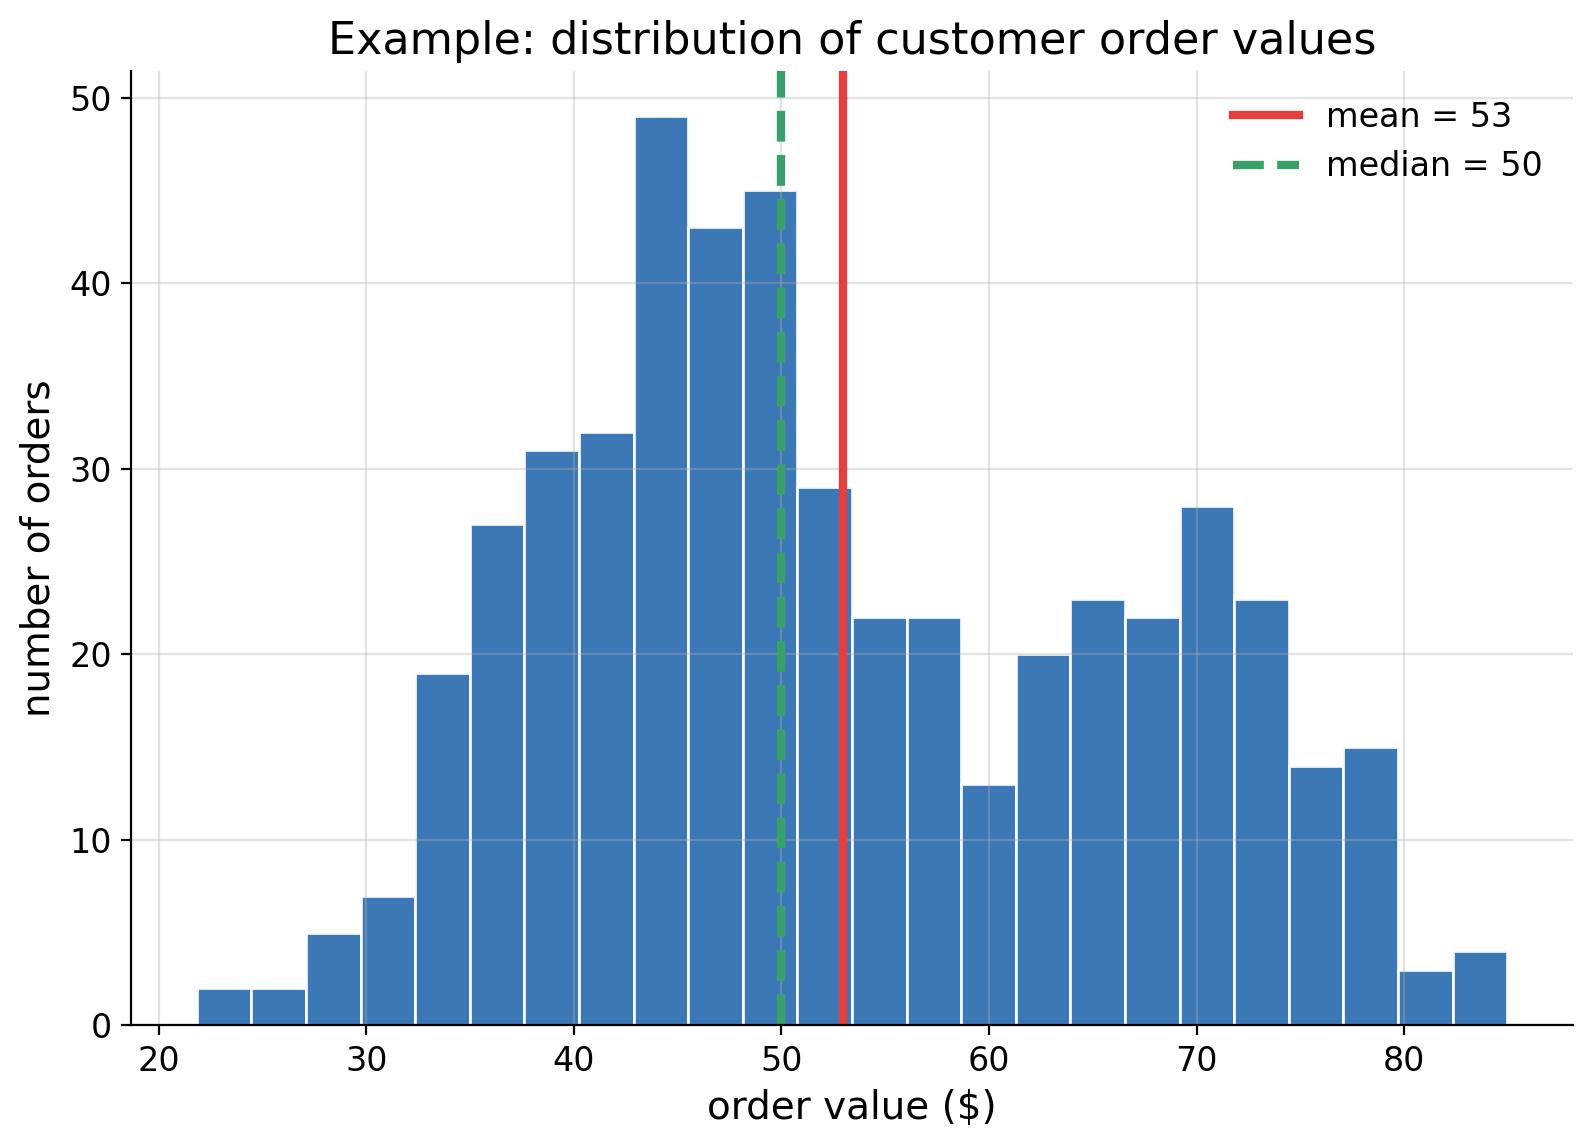
Imagine an e-commerce store. You collect 500 customer orders and build a histogram of order values:
The histogram above shows:
- most orders are between 30 and 60 dollars,
- a second smaller cluster appears around 70 dollars,
- the distribution is not perfectly symmetric.
Why Data Analysts Need Statistics
Statistics protects you from three classic mistakes:
1. Patterns in noise - seeing a "trend" that is actually random fluctuation. 2. Samples that lie - concluding something from a biased sample. 3. Overconfident numbers - reporting a precise average while ignoring uncertainty.
First Example in Python
import numpy as npSimulate 500 order values (mix of two customer segments)
rng = np.random.default_rng(42)
segment1 = rng.normal(45, 8, 350)   # regular customers
segment2 = rng.normal(70, 6, 150)   # premium customers
orders = np.concatenate([segment1, segment2])print(f"count:  {len(orders)}")
print(f"mean:   {orders.mean():.2f}")
print(f"median: {np.median(orders):.2f}")
print(f"std:    {orders.std():.2f}")
Output:
count:  500
mean:   52.50
median: 48.20
std:    12.90
Notice that the mean is higher than the median. That is a clue that the distribution is right-skewed - a topic for the central tendency lesson.
Key Terminology
| Term | Meaning |
|---|---|
| Population | The entire group you want to learn about |
| Sample | A subset of the population you actually measure |
| Variable | A characteristic that can take different values |
| Parameter | A number describing a population (usually unknown) |
| Statistic | A number describing a sample (what you compute) |
| Distribution | How values of a variable are spread out |
Common Pitfalls
- Confusing correlation with causation - ice cream sales and drowning both rise in summer, but one does not cause the other.
- Ignoring uncertainty - a 2% difference in conversion may vanish when you account for sample size.
- Bias in collection - surveying only your most active users will skew every result.
Summary
- Statistics has two branches: descriptive (summarizing) and inferential (generalizing).
- Every analysis starts with understanding your data's distribution.
- Statistics guards against false patterns, biased samples, and overconfidence.
- Python (numpy, scipy, pandas) gives you a full statistics toolbox.
Next Lesson
In the next lesson, you will learn how to classify data correctly: types of data and measurement scales. This is the foundation for choosing the right statistical method later.
Quiz - Quiz - What is Statistics
1. What is the difference between descriptive and inferential statistics?
2. A number that describes a population is called a:
3. Which of these is descriptive statistics?
4. Using 500 orders to estimate the average of all future customers is an example of:
5. Why does statistics protect an analyst from overconfidence? multiple answers